Philosophythe design concepts
How does Oviz compare with X?
Chart.js, Echarts, etc.
Aiming to be a universal visualization framework, Oviz does not particularly focus on charts. It is powerful enough to draw any chart or plot, but it might be overkill when you have very simple demands. Chart libraries such as Chart.js afford abundant predefined options and carefully crafted animations that can be enabled by one switch. Yet, in Oviz, you may need to write a little bit more lines of code to achieve that, at least currently (hopefully we will have a sophisticated chart package based on Oviz later.). Oviz is developed solely by myself, but those preset features for each chart type require massive design and programming work. Therefore, if all you need for your visualization are some basic and attractive bar charts and pie charts, I'd recommend you just pick one of those nice libraries because you may hardly enjoy the full benefit provided by Oviz.
However, if you need advanced customization, for example, adding annotations at arbitrary positions or changing the shape of any graphical elements, those libraries may become less elegant or impotent. In contrast, everything can be customized easily in Oviz, as it is supported natively by its visualization language. You can also assemble charts as parts for more complicated graphs.
Vega, AntV, etc.
These frameworks call themselves visualization grammars. They do excellent jobs on encapsulating common concepts in data visualization and provide much better flexibility compared to those libraries that have fixed chart types. However, in my opinion, they still have two limitations:
Their scope of usage still seems to be constrained in drawing charts and plots. More encapsulation brings more inflexibility because users' choices are limited to the chart/shape types, ways for data binding, and interaction rules defined by the framework. Although existing chart types suffice in most cases, their limitations gradually reveal when designing new methods of visualization.
They still use configuration-based API styles. From JQuery to d3, this has been mainstream for JavaScript libraries,
where users mainly supply options as method arguments or via JSON objects.
On the one hand, styles and behaviors of a component are declared in large nested dictionaries, which brings difficulties to add custom logic and for future maintenance.
On the other hand, users construct graphs by chaining methods like append() or addShape(), which obscures the original graph structure.
When developing really complicated interactive visualizations that involve thousands of lines of code, one should admit that the abstractions and encapsulations provided by these frameworks would be insufficient.
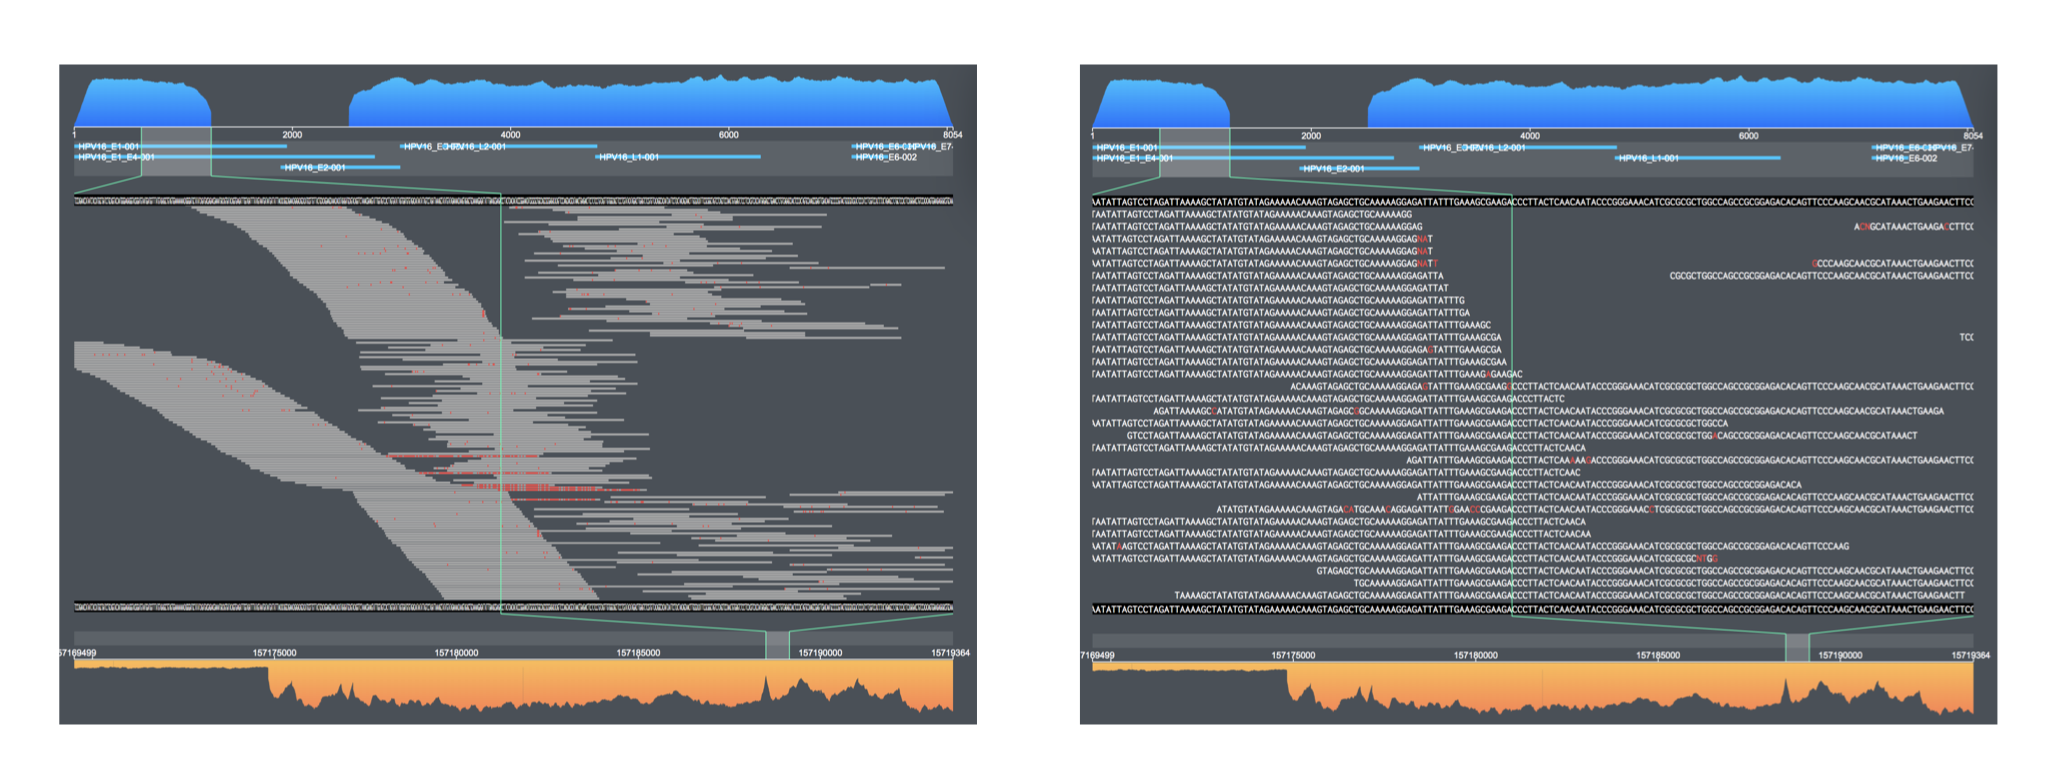
For instance, the figure below is called read supports. Reads are sequences of base pairs (A/C/G/T) corresponding to DNA or RNA segments. They are obtained from a process called sequencing and are aligned to the reference DNA or RNA. The read supports figure shows the aligned reads and errors in them. Since users usually only care about the overall error of all reads, it intially shows a large number of reads as simple lines. However, when users zoomed in the reads area, the figure should display the A/C/G/T sequence to allow them examining the details.
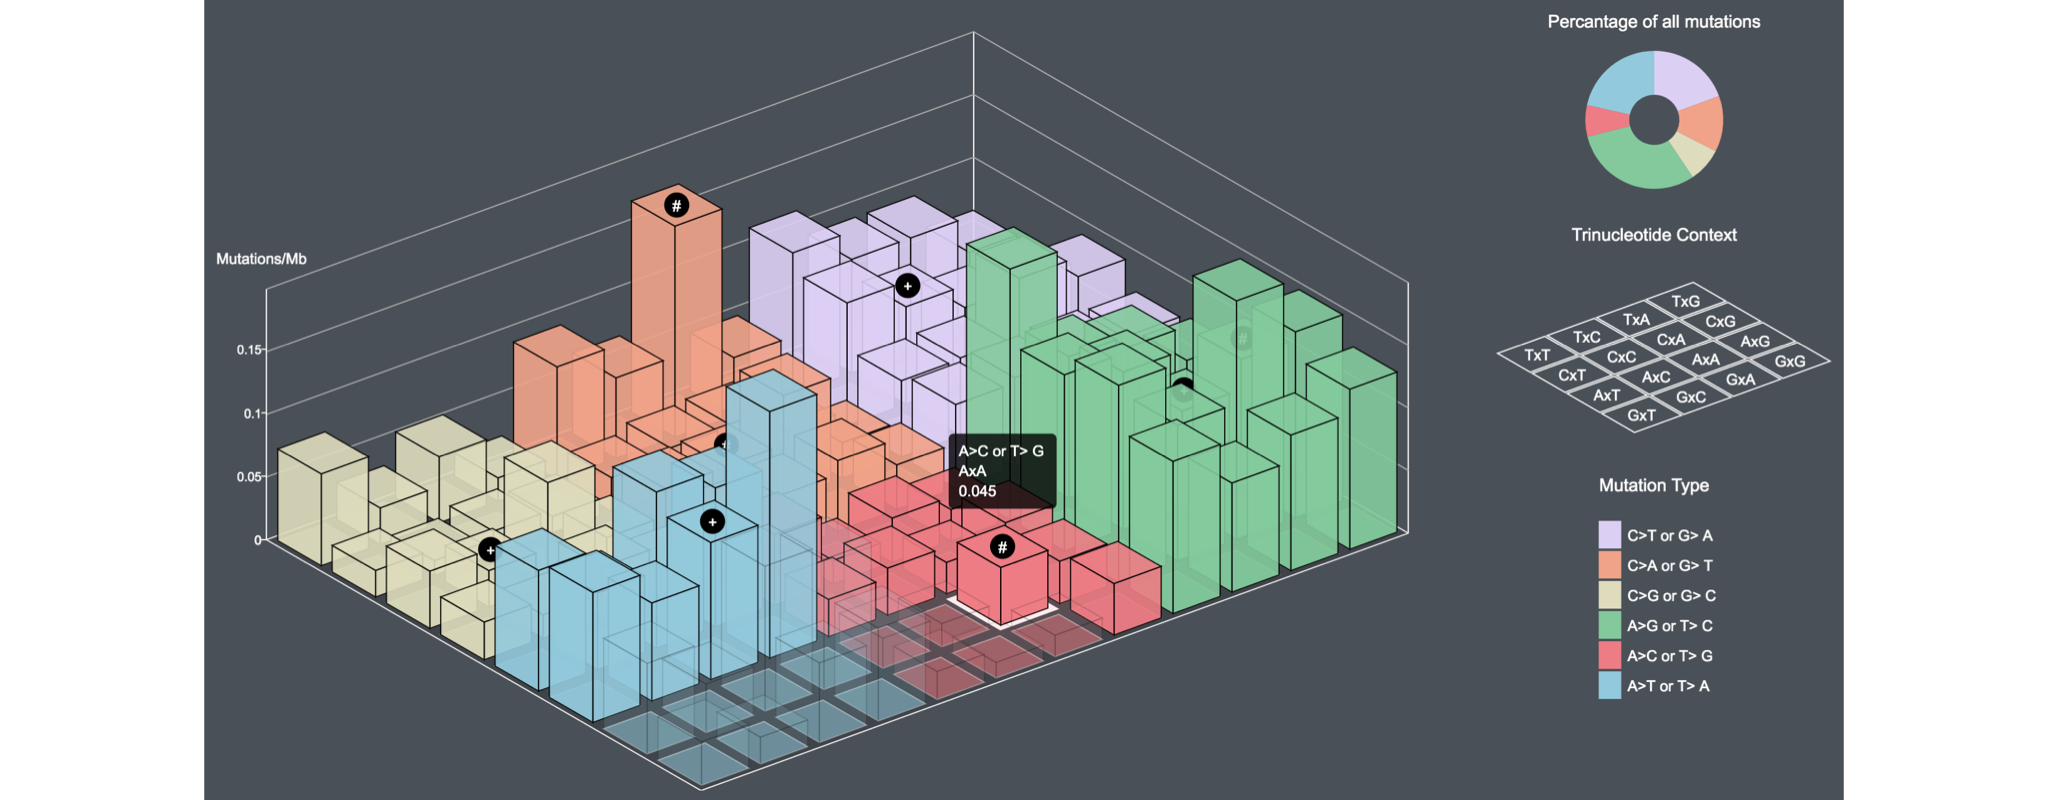
Another example is the SNV context diagram, where a pseudo-3D bar chart is needed to visualize multi-dimensional data. Additionally, when the user moves the cursor, it should reveal the bars at the back that are covered by other bars.
In most of such scenarios where flexibility is needed, d3 might become the only choice for developers.
d3
d3 is not merely a library for graph drawing; it's a collection of visualization algorithms. Actually, Oviz is using d3-scale as the underlying implementation for its scaling system. However, when it comes to rendering and data binding, d3 has its problems.
When manipulating the DOM, d3 uses its unique enter and exit mechanism, which confused lots of learners. The intention is correct: since DOM operations are expensive, only the different parts should be updated each time to achieve better performance. However, nowadays, we already have a more powerful solution in the field of front-end development: virtual DOM. It hides the intricate data diffing process completely so that we can focus on the rendering logic, without needing to worry about which part of the graph should be updated.
d3 binds an array to a group of DOM elements, and children inherit data from their parent. It seems to be pretty straightforward, however, real-world data could be much more complicated. In complex cases, these constraints could become burdens.
Additionally, the rendering API provided by d3 is quite low-level when compared to the above frameworks. Therefore, large projects using d3 might also face challenges when maintaing and extending.
Some examples
We illustrate these problems in the figure below: suppose that we have an array of sections and each section has multiple groups of items.
For each item, a rectangle should be rendered with a width configured in the section, and we should also have a label showing the title of the item;
however, if the show attribute of the item is false, nothing should be displayed. In Oviz, everything works intuitively.
However, in d3 (or other similar frameworks), the structure of the graph is unclear at the first glance, and the data binding seems a little bit awkward.
Of course, we can construct the needed data structures on-the-fly,
but it would require additional work and an extra layer of data transformation.
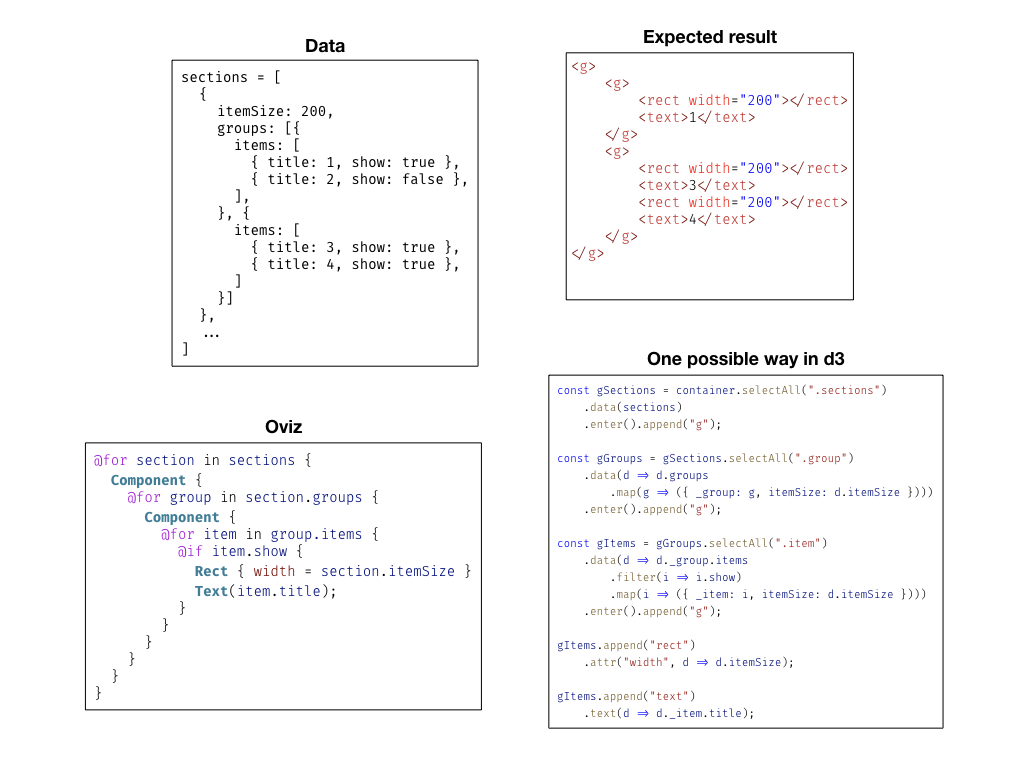
In Oviz, data are not "bound" fixedly to elements; instead, users reference data just like using variables.
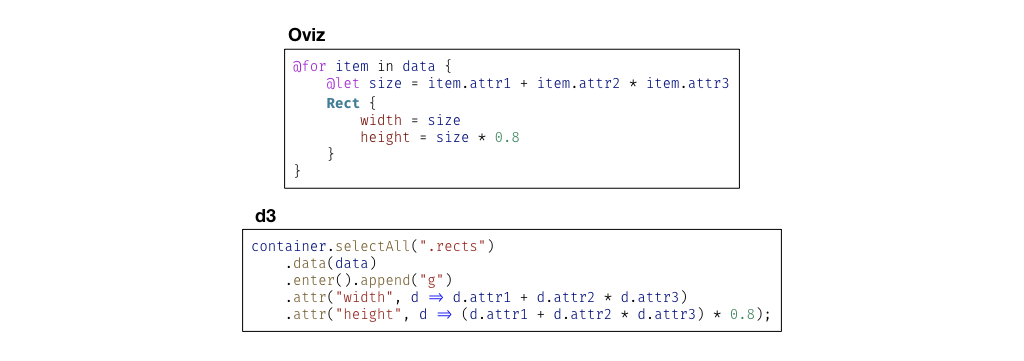
They can declare temporary variables to reduce duplicated code, and a variable remains valid inside the whole block containing it.
In the following example, we can see that the temporary variable declared by @let stores intermediate result that can be used later for all child components.
An intuitive visualization language
The core of Oviz is its visualization language. It is designed to address most of the problems above, as well as to be intuitive and friendly for all users from different backgrounds:
- It uses blocks (
{}) instead of indentions to keep the structure clear when your template is hundreds of lines long. - It does not use the XML-like syntax because it wants to save keystrokes for you to type quotation marks and closing tags.
- You can write commands such as
@ifand@fordirectly inside any block — without any constraint. Nesting is also supported. - You are free to write any JavaScript code inside the template, even though it may seem hacky.
"But I don't want to learn a new language!"
It won't be as complex as a programming language such as Java or Python. If you have learned any of those visualization frameworks mentioned above, it could only be easier to learn Oviz. The language itself contains very little concepts. Once learned, it can meet any need for visualization.
But again, if all you want to draw is a nice bar chart, please feel free to use existing chart libraries.
Components are basic units
Oviz is developed for visualizing anything. This is made possible by using a component-based design.
Components are classes and event listeners are methods. Users customize components externally by supplying props, and components manage their states internally. Components can perform ad-hoc data loading based on user interactions, and when re-rendering, only the changed parts of the graph are repainted.
Oviz does ship with lots of components, but it takes little effort to write your own ones when the built-in components are incapable of fitting your needs.
An obvious benefit of components is that you can get rid of duplicated code segments by moving them into components and share them across projects.
An Oviz component is a collection of graphical elements and behaviors, and users can easily manipulate its internal objects, such as replacing default shapes by custom ones or adding extra items to it. Therefore, a lot of concepts can be encapsulated and represented as a component rather than a dedicated language/library feature, such as Facets in AntV.
There are copious small drawing packages for domain-specific visualizations. For example, to visualize structures of neural networks, people have written packages like NN-SVG and ConvNetDraw. In bioinformatics or other fields, there exist even more of such projects. For instance, schex renders graphs for hexagon cell representations. Using these packages may require installing additional dependencies, and different packages may have different APIs. You have to learn the usage of each one or even write scripts to glue them up. What's more, if you have any special needs, for example, adding annotations on those graphs, the only way may be exporting those graphs and modify them manually using Illustrator or Photoshop.
In Oviz, however, all of them can be written as components and shared in many ways. Visualizations can be loaded and rendered online in browsers, so you don't have to download a package and install its requirements (or even a language runtime) to draw a graph. Components can be assembled and connected freely, therefore you can use those components as parts of your larger illustration. You are also free to add additional graphical objects to them via the built-in features of Oviz.
Oviz is powerful
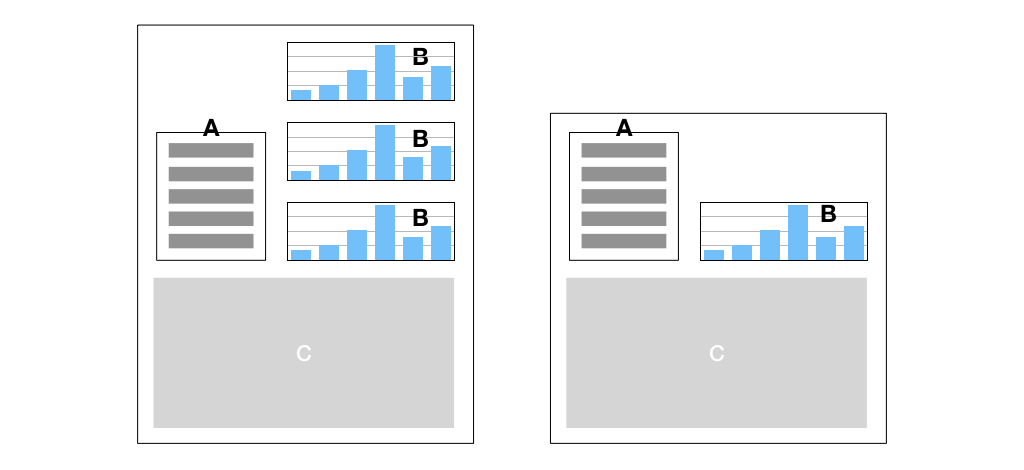
I am not going to show an exhaustive list of what Oviz can do, but here is an example of the auto-layout system, which is one of the major features of Oviz. This example is based on a real case. For our main figure (C), we have a legend (A) with dynamic width and height, because the number and sizes of items inside it may vary depending on input data. We also want to display several bar charts (B) above C, and the number of B is not fixed. Therefore, the vertical position of C is determined by the maximum height of A and all the Bs.
In Oviz, layouts like this can be achieved effortlessly.
We stack the bar charts using a Rows component, and put it into a Columns component together with A.
We also set the alignItems option to "bottom" for it, so that A and B are appropriately aligned.
No math is involved in the whole process.
Similar approaches can also apply to the items inside A and B, and users may configure advanced settings, such as paddings for these container components.
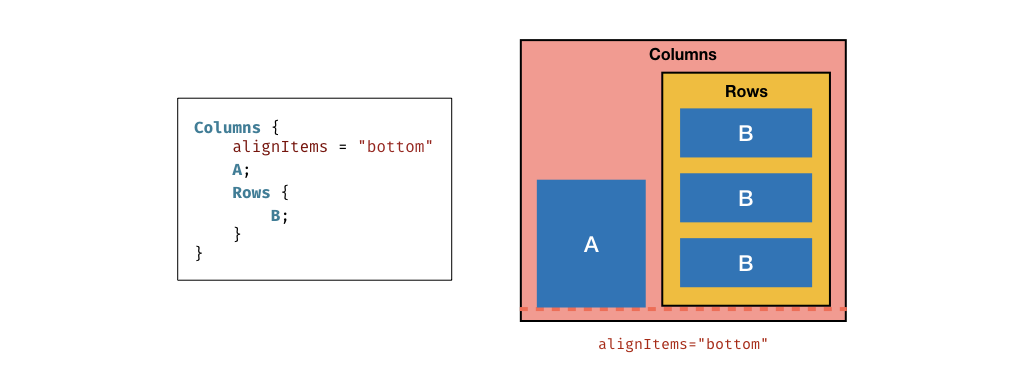
The best part is that there is no magic inside Columns and Rows. They are nothing but standard components.
You can even write your own component that lays out its content in a different way!
Take a look at the simple Clock component on the homepage.
It might be a challenging task to draw such a thing using other visualization libraries, but in Oviz, it's simple and straightforward.
You can even create mini-games using Oviz (but please don't), or write a custom renderer to prevent it from outputting SVGs or Canvas images,
and instead use the raw laid out element tree to fit your particular needs.
Oviz is basically a front-end framework
Oviz is inspired by modern front-end frameworks such as Vue and React.
On the one hand, like React, it leverages the language features of JavaScript.
Each component is naturally a JavaScript class. Updates are triggered explicitly using setState() so it doesn't require injecting observers into your data.
Component updating is based on prop diffing and virtual DOM.
On the other hand, like Vue, Oviz has a relatively independent template system that can be compiled and run in the browser without Webpack (of course, it will support Webpack in the future).
This design enables it to be used in a live coding environment or even to serve as an underlying layer of a completely graphical (Powerpoint-like) visualization design tool.
However, it is not another copy of React or Vue. While you can manage to manipulate SVG using React or Vue, Oviz can render graphs to canvas and even more destinations if you write custom renderers. It also provides an extensive amount of features tailored for visualization, such as the auto-layout system, which is not required in HTML development because it has CSS. Additionally, it has a different internal structure than ordinary front-end frameworks that are optimized for the HTML DOM and business logic.