Featuresprovided by Oviz
Expressive language
Component {
  width = 50
  height = 100%-20
  on:click = handler
  Rect.full {
    fill = "#ffa"
  }
}
Instead of constructing the graph by lines of code, Oviz allows you to describe the structure via its visualization language.
It is designed for users with different technical backgrounds, without requiring knowledge on any specific programming language.
Intuitive grammar
The syntax is simple, flexible and easy to learn. Read the tutorial to get started.
Compiler included
Oviz ships with a compiler that can run in the browser environment. No Webpack or other preprocessors are needed.
Editor support
A VSCode plugin is provided with support for syntax highlighting, auto completion, snippets, and other features.
Layout system
Oviz provides an auto-layout system that works for both SVG and Canvas, therefore
you no longer need to maintain logic for calculating sizes and positions for graphical elements.
Anchors
Components are positioned based on their anchors and relative sizes.
Coordinate systems
Components can have scaling systems or use polor coordinate systems.
Layout components
High-level layout components such as
Columns, Rows, and Box are provided.Component-based framework
The core concept of Oviz is creating and reusing components.
It is dead simple to write a new component that encapsulates graphical elements, data processing logic, and behaviors.
Then it can be used anywhere in your template or even shared across projects.
Sockets and delegates
These two powerful features make custom components incredibly flexible and extensible. Read the docs for more information.
The lifetime and hooks
The lifetime of an Oviz component is clearly defined. Users can add hooks at any point to customize the behavior of a component.
Interactive visualization
Oviz is designed for interactive data visualization.
Simple interactions such as mouseover effects and tooltips can be achieved in the template without incorporating any code;
you can also write event listeners to meet advanced requirements.
States and stages
States and stages provided a simple solution to the internal mutability of components.
Behaviors
Complicated interactions can be abstracted into behaviors and applied to other components.
Theming
You won't be baffled by colors and themes in Oviz.
The built-in theming system supports extendable themes with support for named colors, color manipulation, color schemes, and more advanced features.
Two carefully crafted default themes are provided.


Built-in chart library
Although not designed to be a plotting library, Oviz handles plots and charts drawing excellently from simple bar charts to complicated ones such as the pyramid heatmap. Visit our dedicated charts demo site at chart.oviz.org for more examples.
Uniform extension API
Oviz.use.compnent();
Oviz.use.theme();
Oviz.use.behavior();
Oviz.use.helper();
Oviz.use.renderer();
Almost every part of Oviz is available for extension via a collection of API that conforms to a consistent style.You can even write a custom renderer to prevent it from outputting SVGs or Canvas images, and instead use the raw laid-out element tree to fit your particular needs.
Production-ready
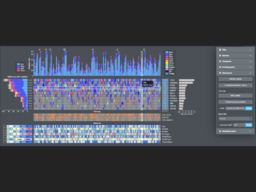
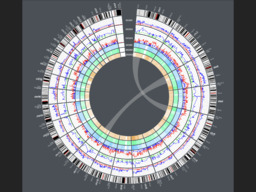
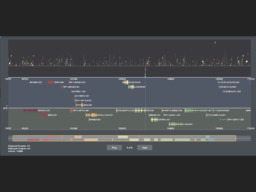
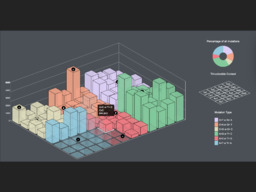
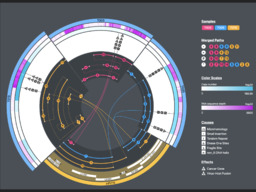
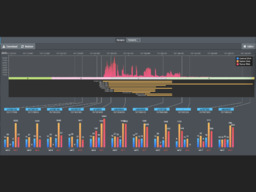
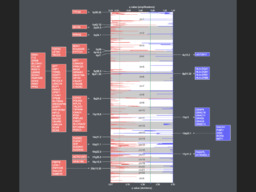
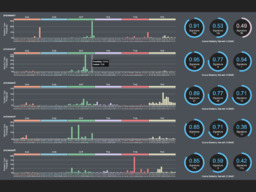
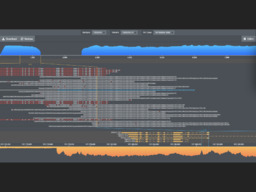
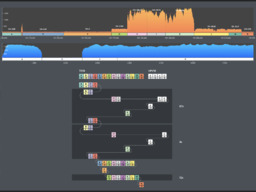
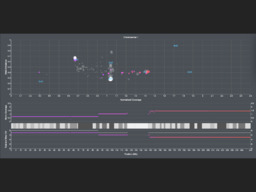
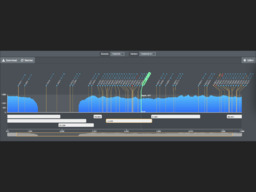
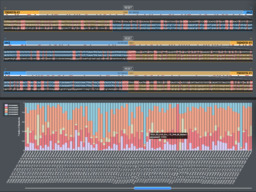
Oviz has been used in multipe published systems, including Oviz-Bio, an integrated platform for bioinformatics data visualization. The following thumbnails show some figures available in Oviz-Bio: